| |
Now comes the fun of graphing! Graphing is usually done in a coordinate system.
Descartes developed the idea to analize geometric shapes by working with the most simple figure of geometry: with straight lines. By intersecting two straight lines we get two axes which give us a coordinate system. Now we can easily assign two values for each point; the intersections of the points' perpendiculars with the two axes gives us two values which determine the position of every point in a plane.

Fermat was also interested in the coordinate system, but he used it more the other way around; he drew the points which satisfy an equation and this way got a picture of this equation. That's what graphing is about.
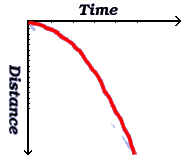
You can see an example on the right. This graph shows how an object which has been dropped changes its position relative to time. It can be described by the function f(x)=x²×16, just as it was discovered by Galileo. In the graph to the right, the curve is drawn so that for any time, if you go down time²×16, you will meet the curve.
To graph a trigonometric function, almost everything can be done the same way as shown above. Just use the sine function instead of using the f function.
Take a look at the graph above. If you move your mouse over it, a red arc will appear to the left. Let's say the radius of that arc has a value of one. In that case the length of the arc is equal to the angle in radians.
To the right of the arc a red line appears. This one always has the same length as the arc. Above, a curve gets drawn. This curve grows together with the straight red line. It's called the sine curve. It's defined by y=sin(x). This means that for every point on the x axis, a point gets drawn which is sin(x) above the x axis where x is the horizontal distance from the origin.
